
There’s one statistic you can measure on social media that is magic.
It has the power to tell you if your audience appreciates your posts and content on social media (even when the algorithms strike).
It will show you what your followers love and what they don’t.
Want to know what it is and how to use it to release the magic?
The statistic is engagement rate
Let’s investigate
Read more about building an online strategy:
- How To Create Time-Saving Reusable Template Emails That Wow Your Customers Read more…
- Are You Neglecting Your Thank You Page? (Plus Examples) Read more…
- How To Write Great Social Media Bios Using The WWHPP Formula. Read more…
- How To Use The Hello Hook Formula To Convert Your Website Visitors (With examples) Read more…
What is engagement rate?
Engagement rate is measured as a percentage. It’s the number of people who saw your content that engaged with it. (Actually, the exact formula changes depending on which social network you use – more on that later).
The higher the percentage, the better.
You can measure the engagement rate of:
Individual posts – Use this to analyse your social content and work out what is working best for you.
Your social account – This will give you an overview of how well your activities on that channel are resonating with your audience. Use it to see which networks to focus time on.
Social networks can limit our reach with their algorithms but one thing that will tell you if your content is right for your audience, even if it doesn’t reach them all is engagement rate.Click To TweetWhy is it important?
Social media algorithms get in the way. They decide what content to show and sometimes they get it wrong.
If we measure success by reach or even the number of engagements a post gets we could miss out on what our audience loves.
Because engagement rate is a percentage, it will tell us how effectively our content resonated with the people who saw it, even if that’s a small group of people.
If 1000 people saw your post, and you got 100 engagements the engagement rate is 10%
If 100 people saw your post, and you got 20 engagements the engagement rate is 20%
Although the second post reached fewer people, it resonated with your audience.
Once you know what posts are working for your audience, you can work out why and develop more relevant content for them.
Keeping an overall score of engagement rate by social network will give you a better idea of which networks are working best for you.
What’s the engagement rate formula?
The formula for calculating engagement rate can vary depending on the network (as you will see in the videos below).
The standard is:

Now let’s look at how to apply this to Instagram, Facebook & Twitter.
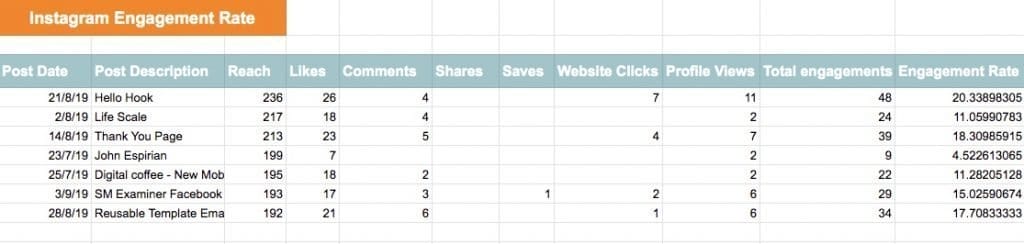
How to calculate engagement rate on Instagram
The problem with calculating your Instagram engagement rate is deciding what to include as an engagement.
Do you just include Likes, Comments, Shares and Saves as Instagram does? Or do you add in other metrics like website clicks and emails?
The video below shows you how to calculate the engagement rate for feed posts but you can use the same formula to stories.
How to calculate engagement rate on Facebook
Measuring engagement rate on Facebook is easier than Instagram. In the ‘Posts’ section of Insights, there is a menu that shows you the engagement rate per post.
To get an overall engagement rate, you need to create a download. I show you how to do both in this video.
How to calculate engagement rate on Twitter
Just when we thought we knew what we were doing with engagement rate Twitter throws us a curveball.
They calculate engagement rate differently to Facebook and Instagram. Instead of using reach as a metric we have to use Impressions.
What’s the difference?
Impressions count the number of times a post has been seen.
Reach counts the number of people who have seen it.
For example, if I see a tweet from you twice in my feed it counts as:
2 x Impressions
1 x Reach
This makes the Twitter engagement rate formula:

Impressions will always be higher than reach so your Twitter engagement rate will see low compared to Facebook and Instagram.
Like Facebook, it’s easy to find the engagement rate for your individual tweets but you have to create a download to calculate your overall stat.
I show you both in this video.
I also found an anomaly in the downloaded statistics when shooting it. Watch to find out more.
What’s a good engagement rate?
I know you want a straight answer to this but I’m going to disappoint you. Engagement rate will vary by industry, audience size and social network.
Instead of measuring against other businesses benchmark your engagement rate against yourself. Keep a regular note of the rate on each network so you can see improvement or decline over time.
What’s next?
Social networks can limit our reach with their algorithms but one thing that will tell you if your content is right for your audience, even if it doesn’t reach them all is engagement rate.
It won’t just tell you what content is working best for you and help you build a stronger content strategy. It will also tell you which social networks are the best for connecting with your audience.
Keep a record of your engagement rates and analyse the content that is performing well. If it has a great engagement rate but isn’t getting the reach you’d expect, see if it will work better on a different network.
Get a headstart on Google Analytics 4 & understand the lingo with the GA4 phrase book


Related Posts:


