
Creating content takes time. Sometimes it takes a lot of time. How do you know that time isn’t wasted? You gotta measure.
Today we’re going to talk about blog measurement. Measurement has been a journey for me. When I first started blogging all I looked at were the numbers. How many people visited my site, what posts did they look at?
As a marketing beginner this is common and in some ways seeing my stats rise from week to week kept me going. It wasn’t long before I wanted to know more.
When I launched Spiderworking I went all in with Google Analytics. It’s a vast tool and there are parts of it I still don’t understand fully but it’s helped me learn about my audience and if I’m hitting the mark with my content.
Listen below to find out how to measure blogging success
Podcast: Play in new window | Download
Subscribe: Apple Podcasts | RSS
Blog measurement and the ‘Circle Of Trust’
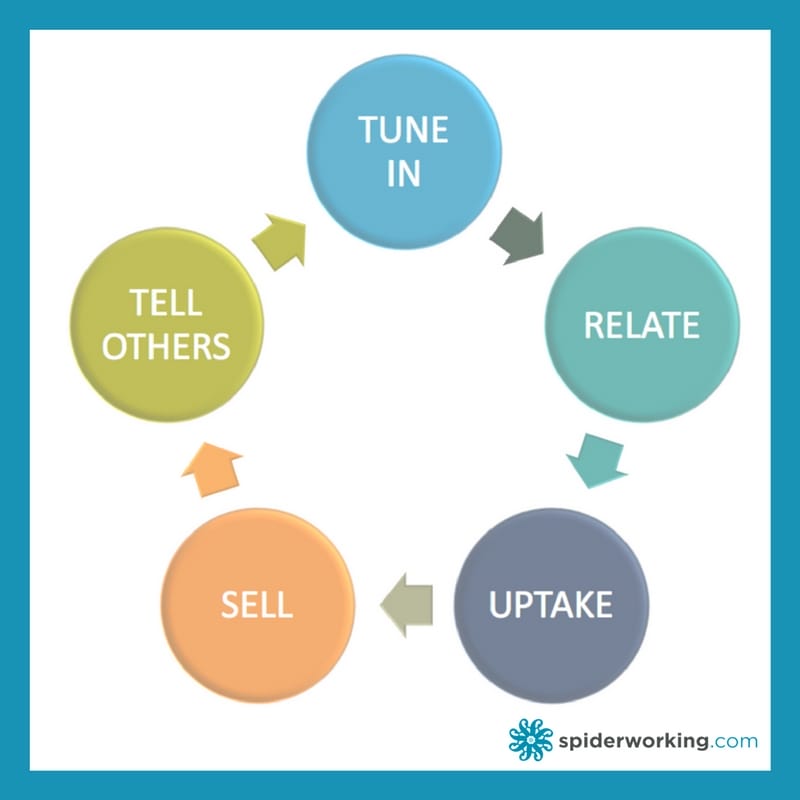
I’m going to talk you through the metrics you need to measure for your blog at each stage of the ‘Circle Of Trust.
If you missed my previous post on ‘The Circle Of Trust’ you may wonder what I’m talking about. It’s the basis of a content plan that ensures you are nurturing your audience at each stage of the customer journey.
The five stages of the ‘Circle of Trust’ are:
Tune In
Relate
Uptake
Sell
Tell Others
For each stage of the circle there are different metrics you can measure to know if you are being successful.
Tune In
Tune in content brings new people to your business. You’re creating posts that will attract them. It doesn’t have to be content strictly related to your business. We’re creating targeted content that will appeal to your ideal audience.
It’s about audience building
But it’s not just the size of the audience, it’s the relevance of that audience. Do they fit into your target market?
Metrics to measure include:
- Relevant people reached
- Audience growth
You also need to note:
- Top posts for reach
Using Google Analytics you can see who is visiting your site. It’s always a relief for me to discover that most people come to my blog from the US, UK and Ireland. That’s my target audience.
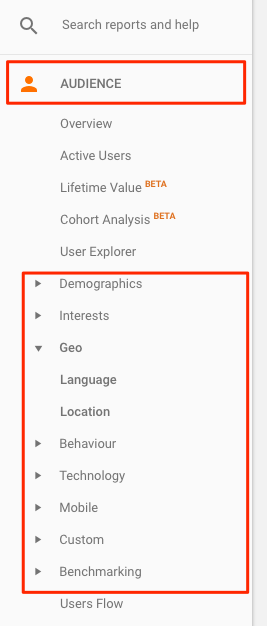
To find this information click the ‘Audience’ tab on your Analytics dashboard. Here you will find data about your site visitors.
- Where do they live?
- How old are they?
- Are they male or female?
- What are they interested in?
- What browser do they use when visiting your site?
- What mobile devices do they use?
This is fascinating data and you can get lost in time combing through it.
For more information you can add a ‘secondary dimension’ to your report. This breaks down the visitor information further.
Click the ‘secondary dimension’ menu at the top of the report page and select a category to add.
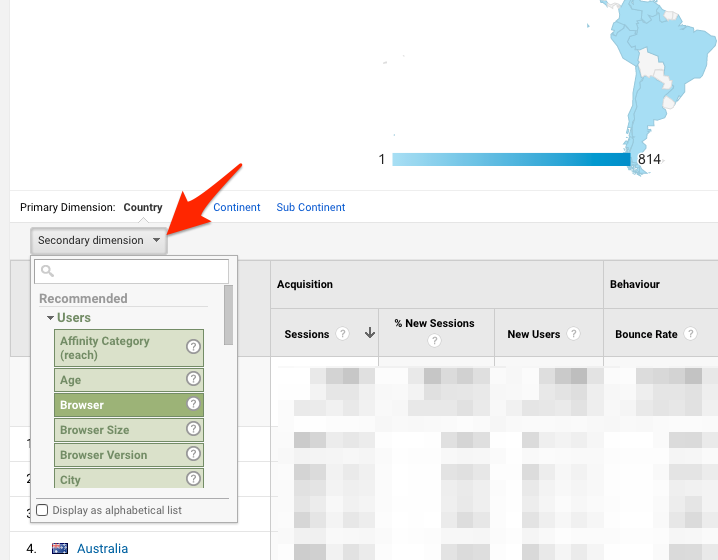
For example. I looked at my users per location and then added a secondary dimension for ‘In market segment’ which tells me a little bit more about the types of products these people are likely to buy.
I can see that a lot of visitors come from the UK and are interested in hotels and travel. I have a similar audience in Ireland.
Top posts for reach
If we want to attract new people to our blog it’s important that our content is getting shared.
BuzzSumo is a fabulous tool for defining the content on your site with the most shares.
Just go to the site. Sign up for a free account and plugin your website address. It finds the posts with the most overall shares.
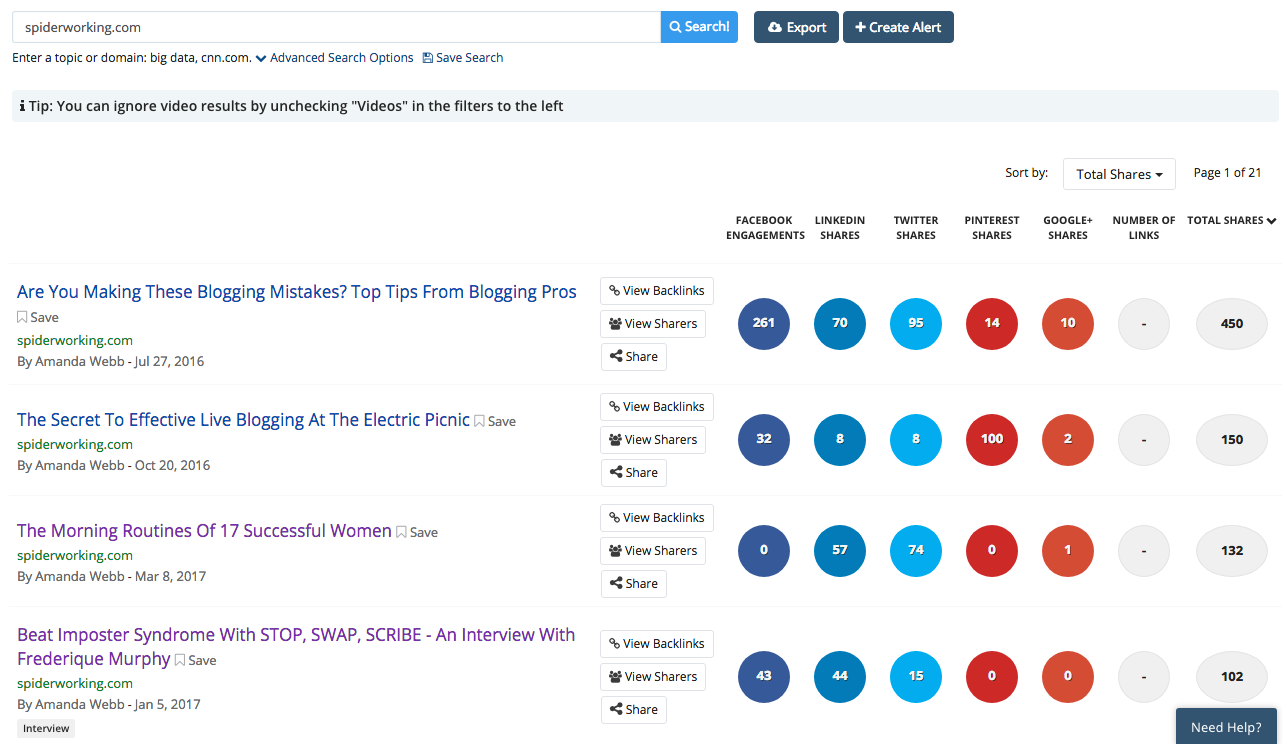
Now you have identified your top Tune In content analyse it. Is it the right sort of content to attract new people to your site/ Is there content similar to it that you could create?
Relate
Tune in content doesn’t have to be about your business, it can be about topics that interest your audience. Relate content is more specifically about you and your industry. It’s not sales content but it’s content that educates your audience a little more.
Metrics include:
- Relevant audience growth
- Relevant engagement growth
You’ll also want to note
- Top posts for engagement
Just like in the Tune In phase, we need to keep an eye on our audience. Particularly the people who visit our ‘Relate’ posts.
For many years I had a popular post that ranked well on Google, it was a Relate style post answering a common issue my clients had. Unfortunately, the info was soon out of date. Although it got massive traction most of the traffic came from people outside my target market.
Look closely at your posts that fall into the Relate category. Are they attracting a good chunk of your target market? If not, can you edit and rewrite those posts so they have more appeal?
If they do work you should reshare them regularly knowing they’ll start to nurture your audience. As well as sharing them on social media look at the places where you have an existing audience. Your Facebook group, your email list. Could you add them to an email nurture sequence?
Relevant engagement growth
It’s all very well people visiting your blog but are people engaging as a result? Engagement means someone is paying attention. An engagement could be a like or comment on social media, a comment on your blog, someone phoning or emailing you as a result of reading, it’s always lovely when this happens.
Facebook Insights
Facebook is particularly good and giving you information about your engagement.
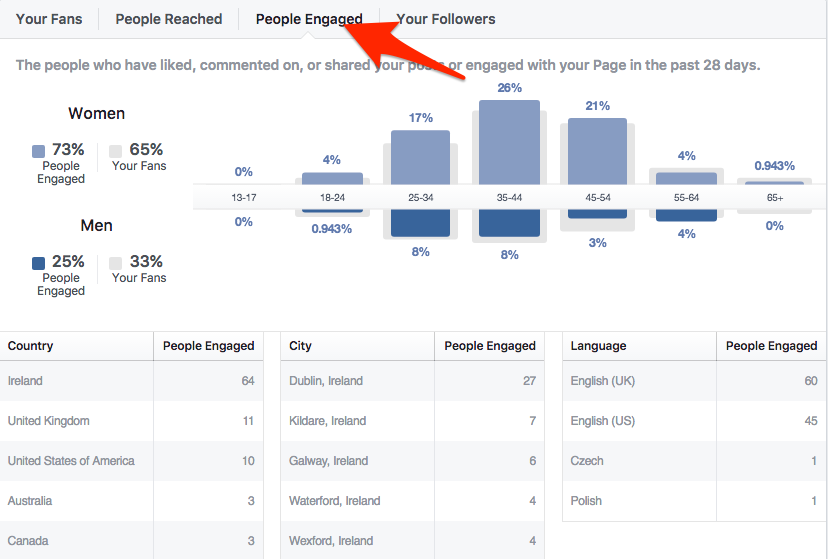
In Insights you can see demographic information about the people who engage with your posts. You’ll find this in the ‘People’ tab under ‘Engaged’.
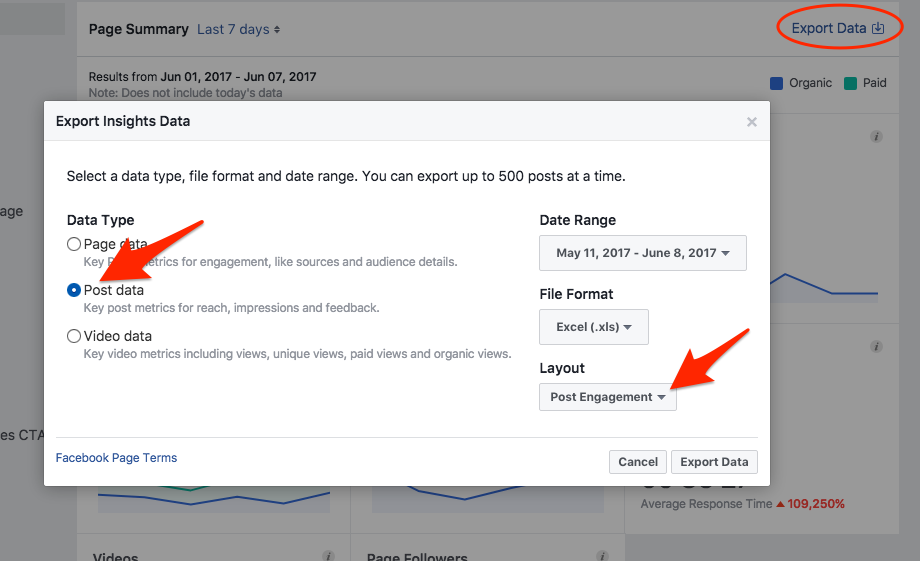
You can also download a CSV of your Facebook insights at post level.
I like to highlight my own blog post shares from the spreadsheet so I can focus on the engagement on just these posts.
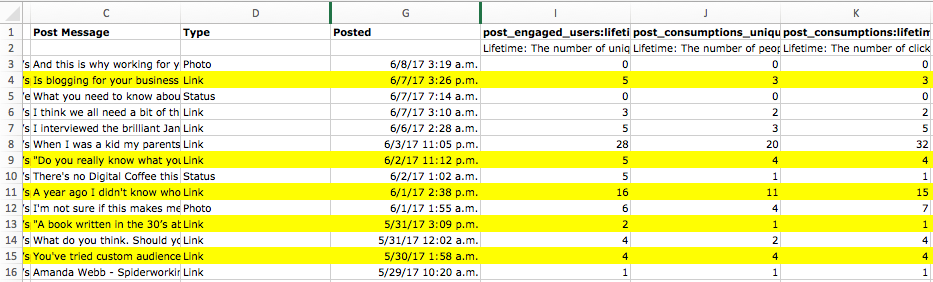
Using this information you can discover which posts get the most traction on Facebook and try and work out why. Is it the image? The headline? The text you wrote to accompany the post?
Tracking social visitors in Google Analytics
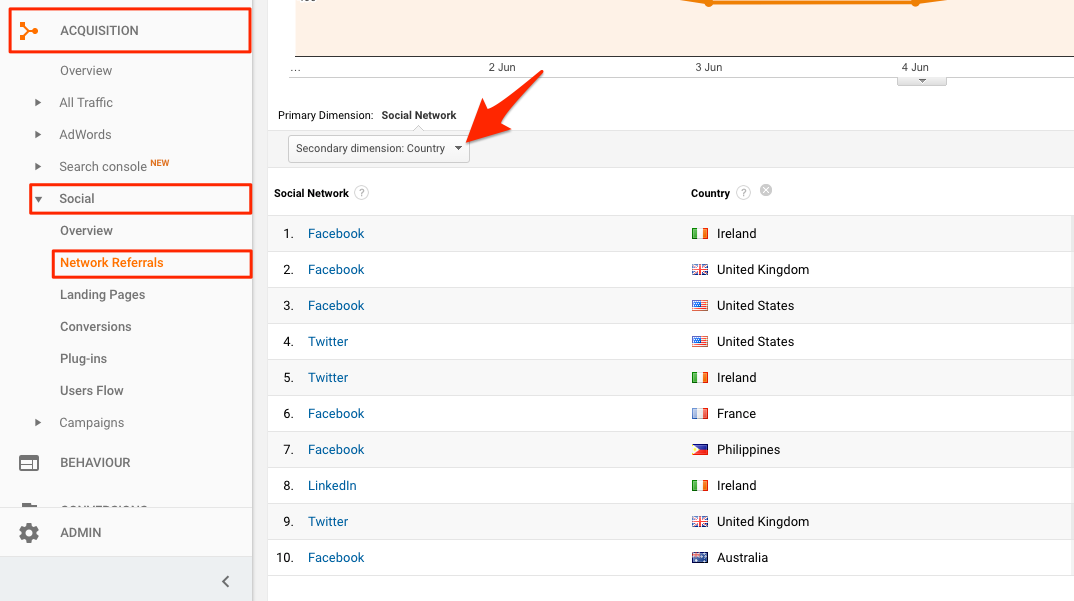
When people click your links on social media what do they do? Are they valuable readers? To find out access the ‘Social’ tab on your Analytics dashboard, under ‘Aquisition’.
Now select ‘Network referrals’ to see the traffic you are getting from each network
Add a secondary dimension relating to your users and you’ll have some idea of how many of these are relevant
Uptake
This is one of the easier sections to measure. Uptake is when someone makes a small commitment to you. They might download a freebie (like my blog post checklist), sign up to your mailing list, make an enquiry through your site.
Metrics include:
- Email subscribers
- Enquiry forms filled
- Traffic to key website pages
- eBook/lead incentive downloads
Also note:
- Top posts for driving traffic to your sign up forms.
The easiest way to measure these activities via Google Analytics is to set up a goal.
To set up a goal you will need a unique thank you page for each goal.
For example, if you have a downloadable freebie you should set up a thank you page that people are sent to once they’ve requested the download.
Grab the link to this thank you page, you’ll need that to set up the goal.
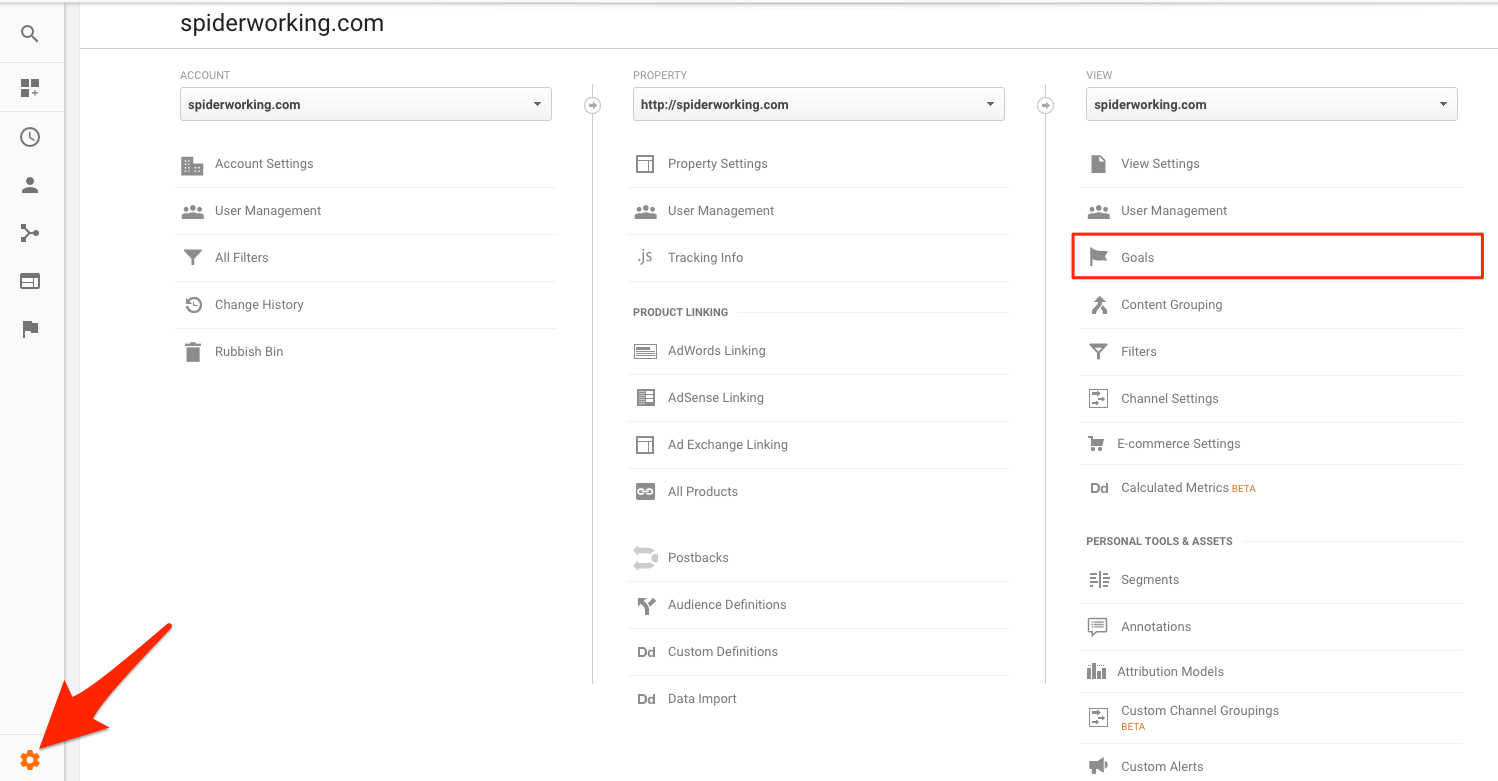
Now in Google Analytics click the ‘Admin’ wheel at the bottom left-hand side of the page.
Select goals and create a new goal
It’s when you get to ‘Goal details’ that you add your thank you page link as the ‘Destination’. You can also add other pages in the step towards reaching the goal.
For example, I want people to reach the landing page for my download before they go to the thank you page. This creates a funnel within Google Analytics.
Set up a goal for each type of enquiry form, download or email subscribe you have. You’ll then be able to view these goals within Google Analytics. There will be goal results columns at the end of each page you access.
You can also get more info on your goals in the ‘Conversions’ menu. This shows completed goals and tracks the path visitors took to reach them.
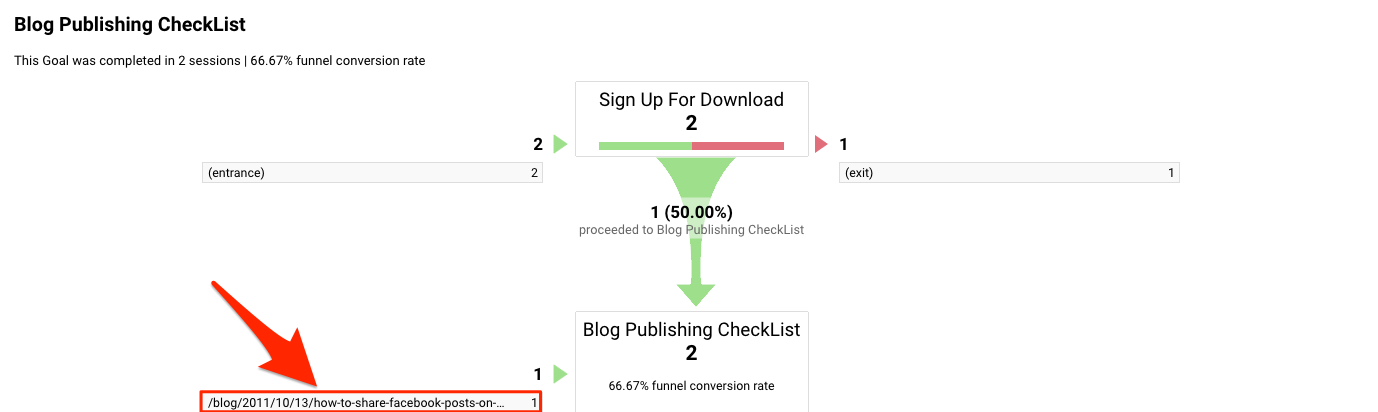
I really like the funnel visualisation view. if you set up multiple steps in your goal creation it will show you how many followed that path.
This is great for measuring the success of Uptake posts. If you wrote about your lead incentive or offered it as a content upgrade you will see how many people downloaded as a result of that post.
In the example below you can see that in the past day 1 person signed up for the download, one left without signing up and one arrived at the thank you page direct (that means they filled in the form on my pop up).
This is great for measuring the success of Uptake posts. If you wrote about your lead incentive or offered it as a content upgrade you will see how many people downloaded as a result of that post.
It’s handy to see how people arrived at your thank you page so you can see which methods are working best and which content is driving readers to subscribe.
Sell
This is the stage where people actually buy from you, you need to make content here as helpful to someone who is about to click the buy button as possible.
Metrics to measure:
- Number of sales
- Revenue per sale
Also note:
- Top posts for driving sales
Just like the Uptake stage, this can be measured by setting goals in Google Analytics. You can assign a monetary amount to each goal so you can easily analyse the return on investment.
If you are an eCommerce business you can integrate your commerce platform with analytics for reporting.
It’s also a good idea to create tracking codes when you share to social media. This will help you identify which posts and ads on which social channels are delivering the most revenue. (This is also useful for the Uptake phase).
Tracking code is a little bit of text that you add to the end of your links when you share them that makes them unique. So you can have multiple versions of the same link pointing to the same page. Each one can be identified in Google Analytics by the code at the end of it.
If you search for URL Builder you’ll find tracking code generators. I use the ‘Google Analytics URL Builder’ plugin for Chrome which streamlines the process.
I’m not going to go into too much detail here as I’ve written about it before.
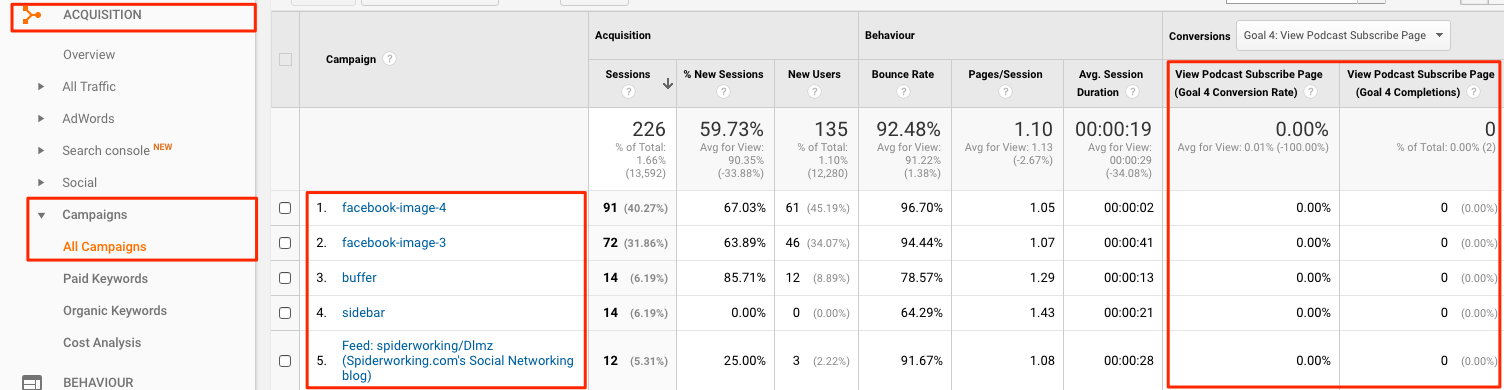
When you add tracking to your links you will reveal more data. Instead of just seeing a mass of traffic from Facebook, you’ll be able to identify which links you shared on what pages, groups or ads are driving that Facebook traffic.
You’ll find information from your tracking links in the Campaigns section of your Google Analytics dashboard.
Tell others
This is the phase where you encourage customers and the advocates you’ve grown to share your content. The type of content that fits here is case studies, user generated content, reviews.
Metrics include:
- Shares of key blog posts
- Reviews
Once again you can use BuzzSumo to find your shared content. You can also track the shares of your key ‘Tell Others’ content manually using your sharing widget.
Make a note of the Tell All content that is performing the best and look at how you can replicate it.
Your Challenge
Now you understand the metrics you need to measure you need to create a measurement plan.
I have a geeky spreadsheet that I complete once a week, on a Tuesday, first thing. This helps me measure trends in my metrics and improve what I’m creating as a result.
It’s important that you set yourself a date for regular measurement. This should be at least once a month but I’d advise you do it more frequently.
I use Excel spreadsheets for this but you could use an alternative. Google sheets may be a better option if you are working as part of a team.
Add each metric you want to measure as a column heading and don’t forget to add the date that you collect the data.
Measuring your blog content this way is motivating. You can identify what’s working and what’s not and you’ll find yourself writing with the end result in mind. My blog has come on leaps and bounds since I started my measurement plan and it always gives me food for thought.
Do Facebook ads make you tear your hair out? Let us manage your Facebook ads for you. We'll save you time and improve results. Get A Quote Now.