• Skip to primary navigation
  • Skip to main content
  • Skip to primary sidebar
  • Skip to footer

Amanda Webb Spiderworking - Google Analytics Setup and Training | Digital Marketing Measurement Support

Your Friendly Google Analytics Geek | Taming GA4 One Report at a Time

  • Tel:+353 1 442 9410
  • Home
  • About
  • Work With Me
    • Google Analytics Done-for-you
    • Training & Mentoring
  • Speaking
  • Blog
  • Get In Touch
You are here: Home / Blogging / Cool Tool – A Quick And Easy Way To View Your Google Analytics – Visual.ly

Cool Tool – A Quick And Easy Way To View Your Google Analytics – Visual.ly

April 8, 2013 by Amanda Webb

Share
Tweet
Share
Pin
Email
WhatsApp

I’ve featured Visual.ly as a cool tool before but this new service is definitely worth a mention.

We all know that Google Analytics can be a time suck, it is so in depth that it can take a long time to sift our way through to the information that we want.  That’s where Visual.ly comes in, presenting our Google Analytics information in an easy to digest infographic.

Here’s how it works:

Click here to visit the site.

visually1

  • If you don’t have an account you will need to create one. Otherwise just sign in.
  • You will then be directed to log in with your Google account
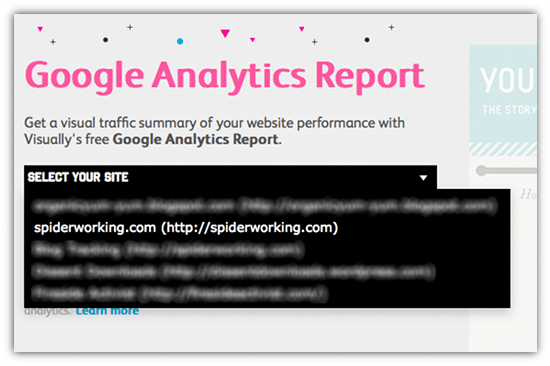
  • If you manage more than one site from your Google Analytics account you will need to choose the site you want the report for
  • visually2
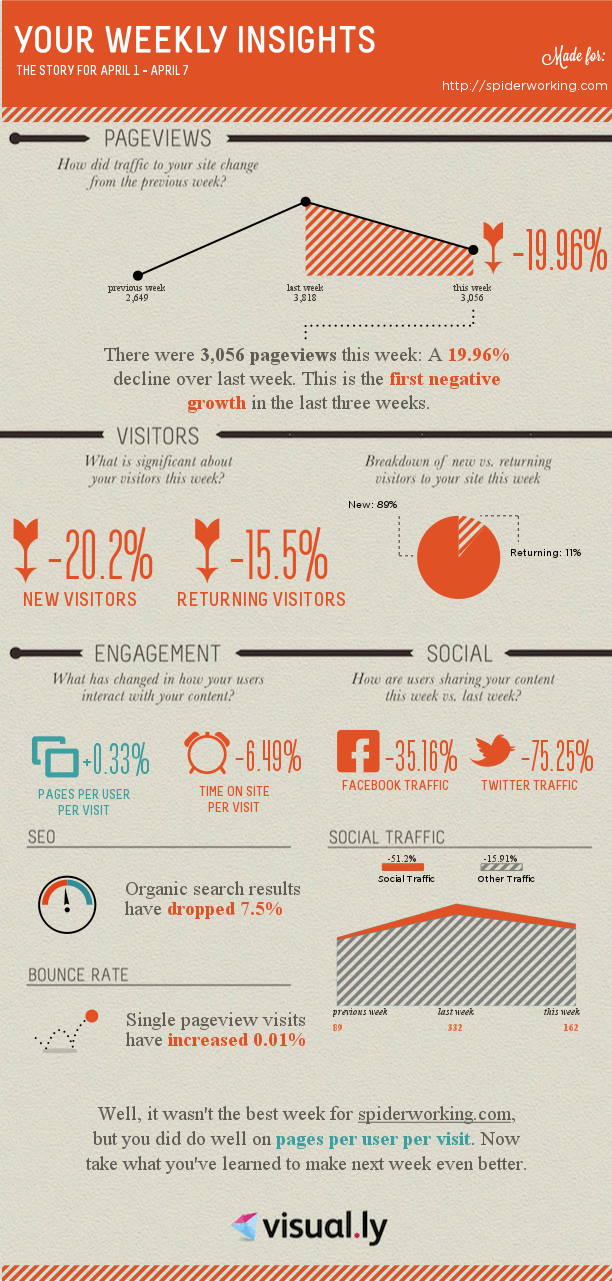
Visual.ly now quickly creates your report of headline stats for the last week. Here’s mine. It’s a bit depressing as there’s been a drop in visitors after a very successful week previously.

googleanaltyicsreport

  • If you like what you see you can choose to get a weekly report emailed to you.  This is an option I’ve chosen.

visually3

If you enjoyed this blog post why not subscribe to my newsletter or my blog posts via email. Click here for more info.


Related Posts:

  • Amanda looks cool, I mean she's got shades, she's got a biker jacket. Her hair is red and her skin is white. the text reads 'Custom events - no tag manager'
    4 Simple Google Analytics 4 Custom Events You Can…
  • tweets-on-instagram
    Twitter On Instagram? - Digital Marketing News 2nd June 2023
  • search-console-ga4
    What search terms are people using to find my…
  • Amanda is zapping a signal out of her head.
    Should You Switch Google Signals On In Analytics?
Share
Tweet
Share
Pin
Email
WhatsApp

Filed Under: Blogging, tools Tagged With: google analytics, infographic, visual.ly

Primary Sidebar

Work With Me

From Google Analytics Training to the ROI Escalator Programme. Find out how I will help you get more ROI for your business

Amanda, smiling with red hair draped over her shoulders. You can trust her (but I would say that wouldn't I)

Get ROI Help Straight To Your Inbox

Get daily tips and inspiration on how improve your digital marketing ROI using analytics

Privacy Policy

Let's Connect

let's connect on LinkedIn Subscribe on YouTube Follow on Facebook

Footer

Google Analytics Certified
Very Blog Awards Winner
Social Media Examiner Winner
Social Agency Scout
  • Done For Your Google Analytics 4 Packages
  • Training & Mentoring
  • Speaking
  • That Analytics Podcast – Learn to love your stats
  • FREE Webinar: Finding the Gold in Your Google Analytics
  • Get In Touch

© Copyright 2017-2024 Spiderworking.com - Social Media For Small Business · All Rights Reserved · Privacy Policy · Cookie Policy · Maintained by FlyingFish.ie